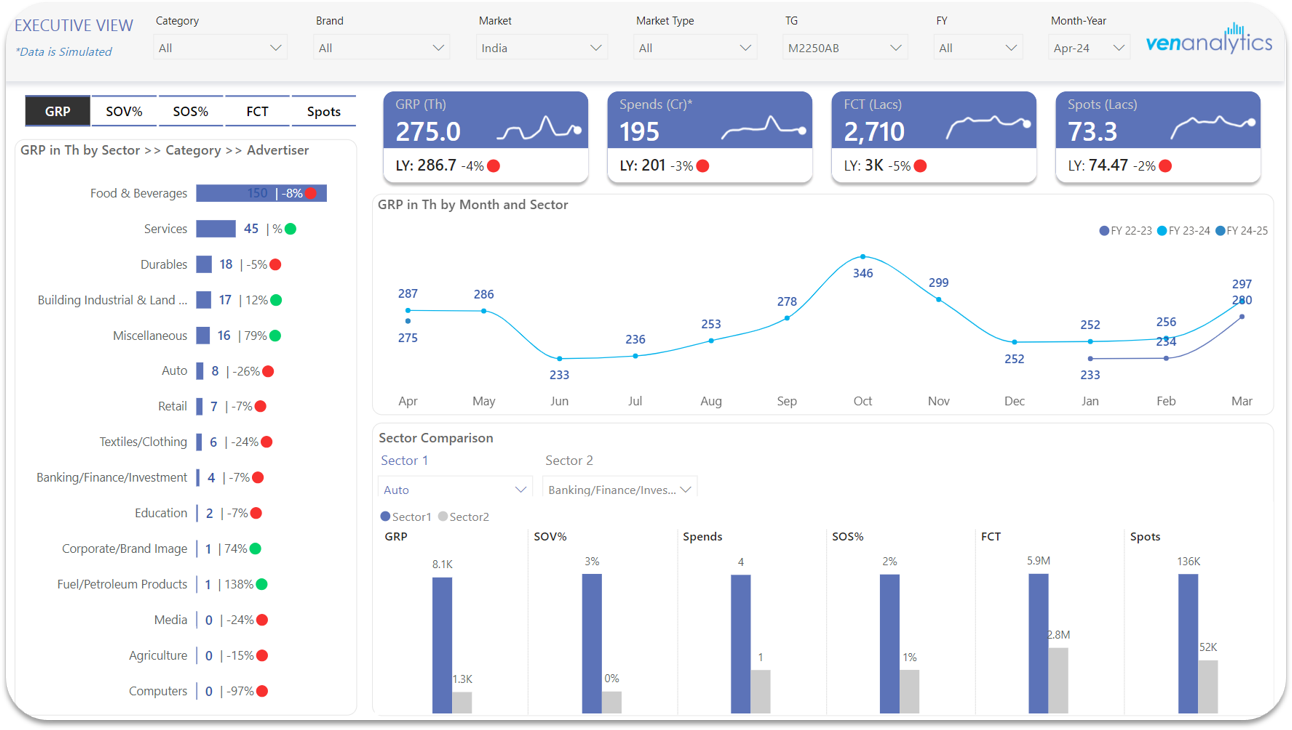
TV AdEx Dashboard
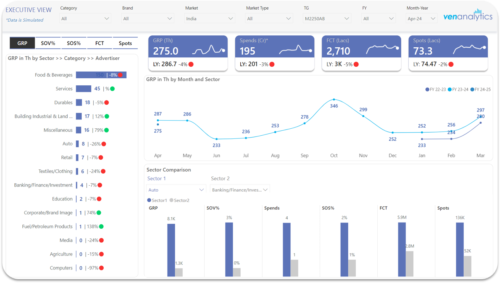
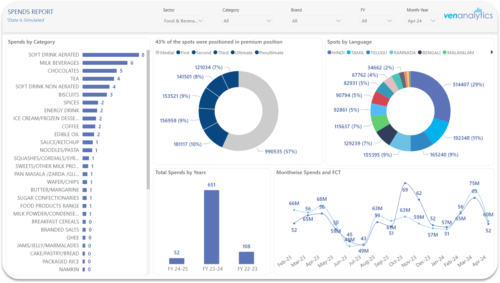
Understand TV Ad Spends over years. Spends / FCT / Ad GRPs by by various cuts viz. Sector, Brand, Commercial Edit etc. Identify sectors that have grown, identify emerging brands, upload your own rate card and get the best revenue estimates.
- Category : Business Intelligence Linear Media YUMI
Problem Statement:
- Getting a single page view for all media spends across India can take hours of data fetching, massaging and reporting.
Solution
- A well-designed architecture can help you with the same. We fetch data from YUMI and TAM and upload it in a central repository and the rest is automated.
- There is no limit as to how much data can be ingested in the database, however in current scenario we have successfully visualized 3 years of brand level data with customizable rate card to calculate spends.
Features
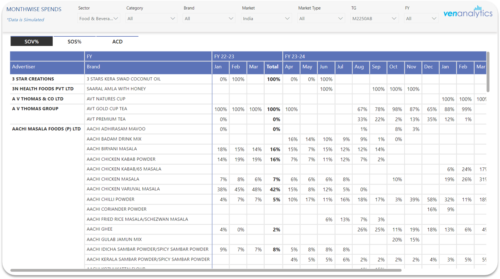
- Spend Analysis: Upload your own rate card and get spends across Brands
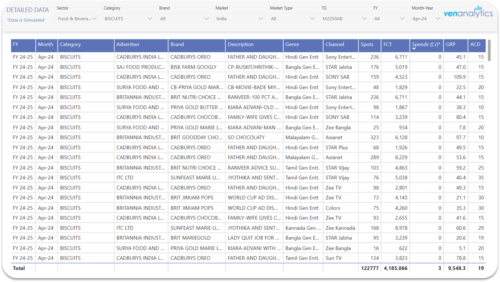
Big Data: The dashboard is powered by 3 years of Brand Spot Listing runs across all markets and up to 25 TGs. The total size of backend data is up to 1.5 TBs - Key Metrices: Dashboard has all the Key metrices covered such as GRPs, Spends, FCT, Spots across important cuts like Sector, Ad Caption, Language, Spot Position etc.
Pricing
- Free Trial: 1 Month Free for 3 users
- One time Setup Cost: 1L
- Subscription Cost: 15K / Login / Month
- Infra Cost: Depends on Data Size
Tech Stack
OUR WORK
Other Case studies
YUMI
TV AdEx Dashboard

Web Application
Digital Campaign Management
YUMI
RLD Analytics

YUMI
TV AdEx Dashboard

YUMI
RLD Analytics

Web Application
Digital Campaign Management

YUMI
RLD Analytics

YUMI
RLD Analytics

YUMI


