


Posted on Dec 13, 2024, by Shubham Chaudhari on Data Model Distribution via Power BI
Data analysis and reporting are at the heart of every successful data-drive organization. Power BI, a user-friendly and robust business intelligence tool, allows companies to transform raw data into meaningful insights and share them effortlessly. But effective distribution of these data models isn’t just about sharing reports—it requires strategic planning to ensure that insights are accessible, secure, and run smoothly.
In this guide, we’ll break down simple and effective strategies for distributing Power BI data models so you can get the most value from your data.
1. What Is Data Model Distribution in Power BI?
Sharing of content across the organization (or outside) in a secure way is possible using Power BI Service. We can either share Power BI reports or empower our teams to build custom reports by publishing centrally governed datasets. These datasets in Power BI are called Data Models. Depending on your role in the organization, the definition of content will differ for you. If you are an Analyst or an author in liaison with the business user, you would be developing reports and sharing these with the end users. However, if you are part of the data engineering or a central IT team, your definition of content is the data models that empower Authors to develop reports.

2. Picking the Best Way to Share your Data Model
Power BI provides multiple avenues for distributing your data models, each designed to cater to specific needs. Let’s break down these methods so you can decide which one works best for your situation.
A. Workspaces: A Collaborative Space for Teams:
Workspaces in Power BI serve as a shared environment where team members can manage and collaborate on reports, dashboards, and datasets. They are designed to facilitate teamwork while ensuring data security through role-based access controls.
- Role Assignments: Within a workspace, you can assign different roles that determine what actions a user can perform:
- Admin: Completely controls the workspace, including managing content, members, and settings.
- Member: Can create and edit reports but doesn’t have control over administrative settings.
- Contributor: Allowed to build and update content but restricted from sharing it or changing permissions.
- Viewer: Can only view reports and dashboards, with no ability to make edits.
- Benefits of Collaboration: Workspaces make it easy to co-author reports, track changes, and update datasets collaboratively. For instance, your business team can work together to update the campaign performance dashboards and ensure everyone has access to the latest insights.
- Controlled Access: You can restrict sensitive reports to certain roles. For example, budget reports can be limited to finance teams, protecting confidential information while still encouraging collaboration where necessary.
B. Sharing Links: A Quick Way to Distribute Insights:
When speed and simplicity are priorities, Power BI’s link-sharing feature is an effective way to get reports into the hands of your audience. This method is straightforward and doesn’t require users to navigate complex data models.
- How It Works: You can generate a unique link for any report or dashboard in Power BI, which can then be shared with the audience.
- Setting Permissions: You can decide whether the link allows users to view or, in some cases, edit the content. Most organizations restrict these links to viewing only, ensuring that the data model remains secure and unaltered.
- Use Scenarios: Link sharing is great for when you need to distribute reports quickly, such as sharing a sales update with managers or providing an overview of key metrics to executives. The simplicity of this method ensures everyone can easily access and understand the insights without any technical hurdles.
- Security Aspects: Always be cautious with permission settings. Make sure the link is accessible only to people who need it, especially if the report contains sensitive information
C. Embedding:
Embedding is a more sophisticated option that allows Power BI reports to be incorporated directly into other applications, providing users with a streamlined experience. It’s particularly beneficial for companies looking to integrate analytics into their daily workflow.
- Embedding Types:
- Internal Integration: This allows employees to access Power BI reports from within commonly used business apps, like a CRM or internal portal. This saves time and keeps data right where it’s needed the most.
- Public Display: In cases where reports need to be shared with an external audience, like on a website or in a client-facing app, embedding is a seamless way to present insights. However, make sure that no confidential information is included in publicly accessible reports.
- Data Security: Embedding comes with robust security features. Unlike sharing the data model directly, embedding keeps your dataset safe, as external viewers cannot access the underlying data. Power BI enforces security through mechanisms like token-based authentication and permissions tied to Azure Active Directory.
3. Keeping Data Safe and Secure
Data security is non-negotiable when sharing insights. Here are some ways to protect your data models:
- Role-Based Access Control (RBAC): Assign roles like viewer or editor to manage who can see or edit your data. For instance, you can ensure that only finance staff access financial reports.
- Row-Level Security (RLS): Limit what data each person can see based on their role. For example, someone from the East Coast office should only view data relevant to their region.
- Data-Level Security: Further tighten security by restricting data access based on user groups or specific attributes.
- Data Encryption: Always encrypt your data both when it’s stored and when it’s being transferred to keep sensitive information safe.
4. Making Your Data Models Run Faster
Large datasets can slow down your reports. To keep things efficient, follow these tips:
- Reduce Data Load: Only load what you need. Use filters or query-specific fields to lighten the data load. These speeds up performance and saves memory.
- Use Aggregations: Summarize large datasets into aggregated tables. These tables provide quick answers to common queries without needing to process every data point. Streamline DAX Calculations: Simplify your DAX formulas. Complex calculations can slow down your reports, so use efficient DAX expressions whenever possible.
- Minimize Relationships: Keep your data model simple. A star schema design (with central fact tables connected to dimension tables) makes data retrieval faster and more reliable.
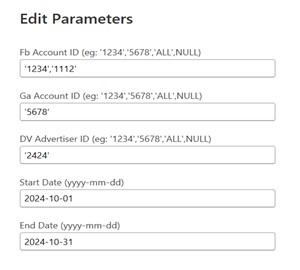
defining parameters, for e.g., Account_ID, Advertiser_ID, Start Date and End Date, you can dynamically filter and control which records are pulled from your data source. This method is particularly beneficial for restricting data to a specific date range, ensuring your model stays streamlined and efficient.
5. Keeping an Eye on Distributed Data Models
Even after distribution, your job isn’t over. Here’s how to keep everything running smoothly:
- Track Usage: Power BI’s usage metrics let you see who’s using the reports and how often. This helps you identify underused reports or areas for improvement.
- Manage Data Refreshes: Set data refresh schedules that match your organization’s needs. Refreshing too often can strain your resources, while not refreshing enough can make your data stale.
- Regular Updates: Listen to user feedback and continuously optimize your data model. Test any updates thoroughly to make sure they don’t break existing reports or slow down performance.
6. Collaborate and Govern Wisely
Good collaboration and governance keep your Power BI data models reliable:
- Document Everything: Clearly explain your data sources, relationships, and any special calculations. Documentation makes it easier for others (and your future self) to understand the model.
- Version Control: Keep track of changes to your data models. Version control helps you roll back to previous versions if needed.
- Data Governance Framework: Set up rules for how data is managed, named, and used. This ensures
consistency and makes it easier for people to understand and trust the data.
7. Wrapping it Up
- Sharing Power BI data models can significantly boost your organization’s ability to make data-driven decisions. By choosing the right sharing method, securing your data, and optimizing performance, you’ll ensure your reports are effective and easy to use.
- Whether you’re a Power BI veteran or just starting, these strategies will help you get the most out of your data models. Remember, it’s not just about creating insights—it’s about sharing them efficiently, so they drive action and results.
Please drop us a mail on hello@venanalytics to get a free consultation for your Data Model Distribution via Power BI.