

RLD – Opportunities and Beyond Last year October Broadcast Audience Research Council (BARC) – sole TV Viewership Monitoring Entity in India – announced the release of Respondent Level Data (RLD) for Broadcasters. While it was accessible to Media Agencies before that, releasing the data to broadcasters was new. Before I explain what RLD is let […]
This article is for all Media Planners, Analysts, and Data Engineers dealing with digital campaign management platforms like Google Ads, DV360 or Meta. We have extensively worked on the reporting side of these platforms, and or experience says that creating a scalable data model for your reporting teams can turn out to be quite challenging. […]

Business Case: To understand spending patterns in advertisements through the four mediums of TV, Radio, Print and Digital across the two sectors of Retail and Service. Solution: Analyzing and comparing the spending across mediums and diving deeper into the sectors and the product itself. Technology used: Power BI and Excel Data Source: The report is […]

Business Case: Understand advertisement spends through the three mediums of TV, Radio and Print along with key metrics like GRPs, NGRPs, SOVs across multiple media channels and Dayparts. Solution: Analyzing the spending across mediums and diving deeper into the sectors and the product itself. We also want to understand how the key metrics impact these […]

Business Case: To analyze operations and volumetrics related to insurance premium and derive appropriate trend analysis from the data. To understand and dig deeper into the different types of policy. Solution: To create an overview that spans information about policies, premiums and gives a trend analysis in terms of relevant KPIs. Technology used: Power BI […]
As a DevOps engineer, the choice of cloud platform can significantly impact both workflow and project success. Amazon Web Services (AWS), Azure, and Google Cloud Platform (GCP) are three major players in the cloud services market, each of them offers a unique set of features and pricing structures. In this blog post, we’ll explore these […]

Posted on May 11, 2019 by Hrishikesh Joshi in AI | Media | Entertainment A few months back a paper published by Anacondas “Why Your Business Needs an AI Platform” caught my attention. The Value creation Matrix in the paper describes the impact of AI ($billion) verses share of AI impact in total impact from analytics. What surprised […]

OVERVIEW: Communicating insights through data visualization is not easy, even with the best Business Intelligence Tools at our disposal. Many a times we find ourselves struggling to communicate clear-cut insights. One such use case is Customer or Market Segmentation problems. Scatter plots are often the go-to visuals in this case. However, they fail miserably if […]
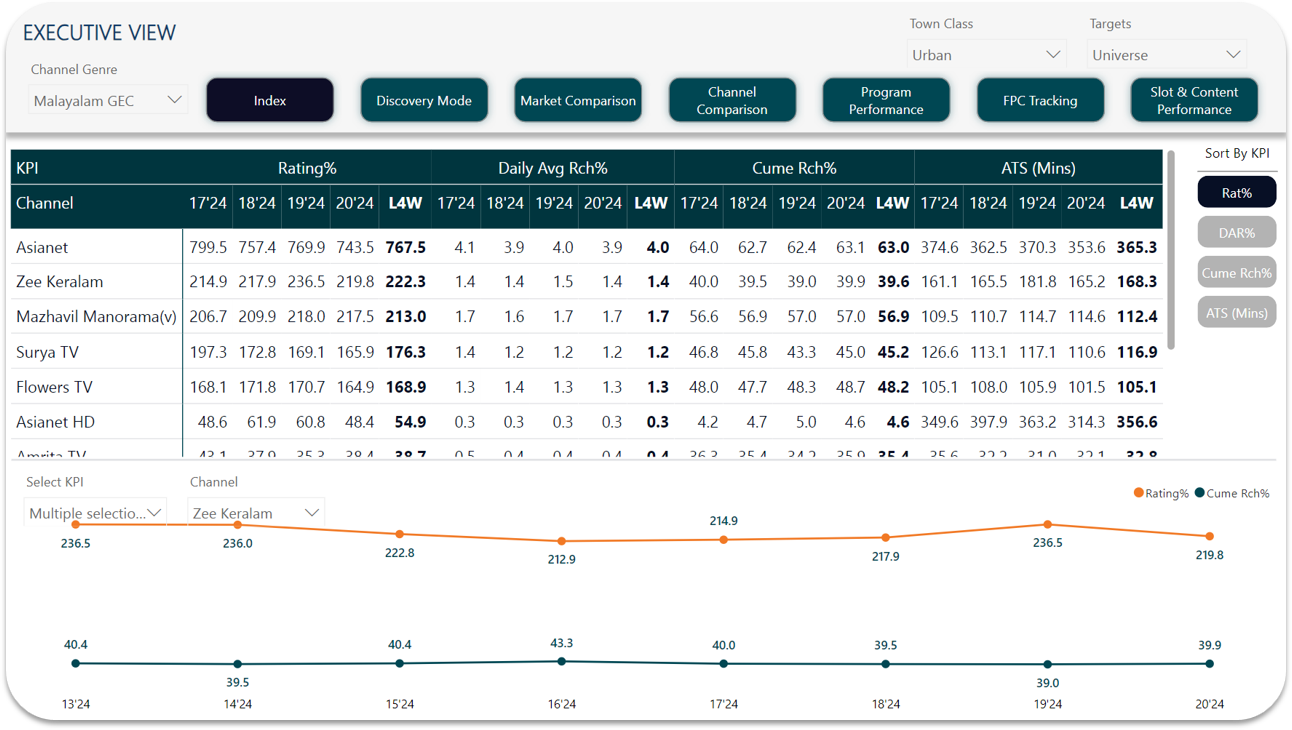
Business Case: To analyze and tell a story about viewership data for the particular channel. Understanding and viewing trend patterns across markets, channels and content while also comparing them. A proper deep dive into every aspect of the necessary KPIs and GRP ratings. Solution: To create a consolidated view of market, channels and performance […]

Posted on Aug 16, 2019 by Rhishikesh Joshi in AI | Media | Entertainment Problem: Let us start with explaining you in brief the business problem in Indian Media Industry that we intend to tackle. There are majorly 4 stakeholders viz. Advertisers, Media Agencies, Broadcasters and Broadcast Audience Research Council (BARC) – central rating agency. Advertisers hire Media Agencies to […]
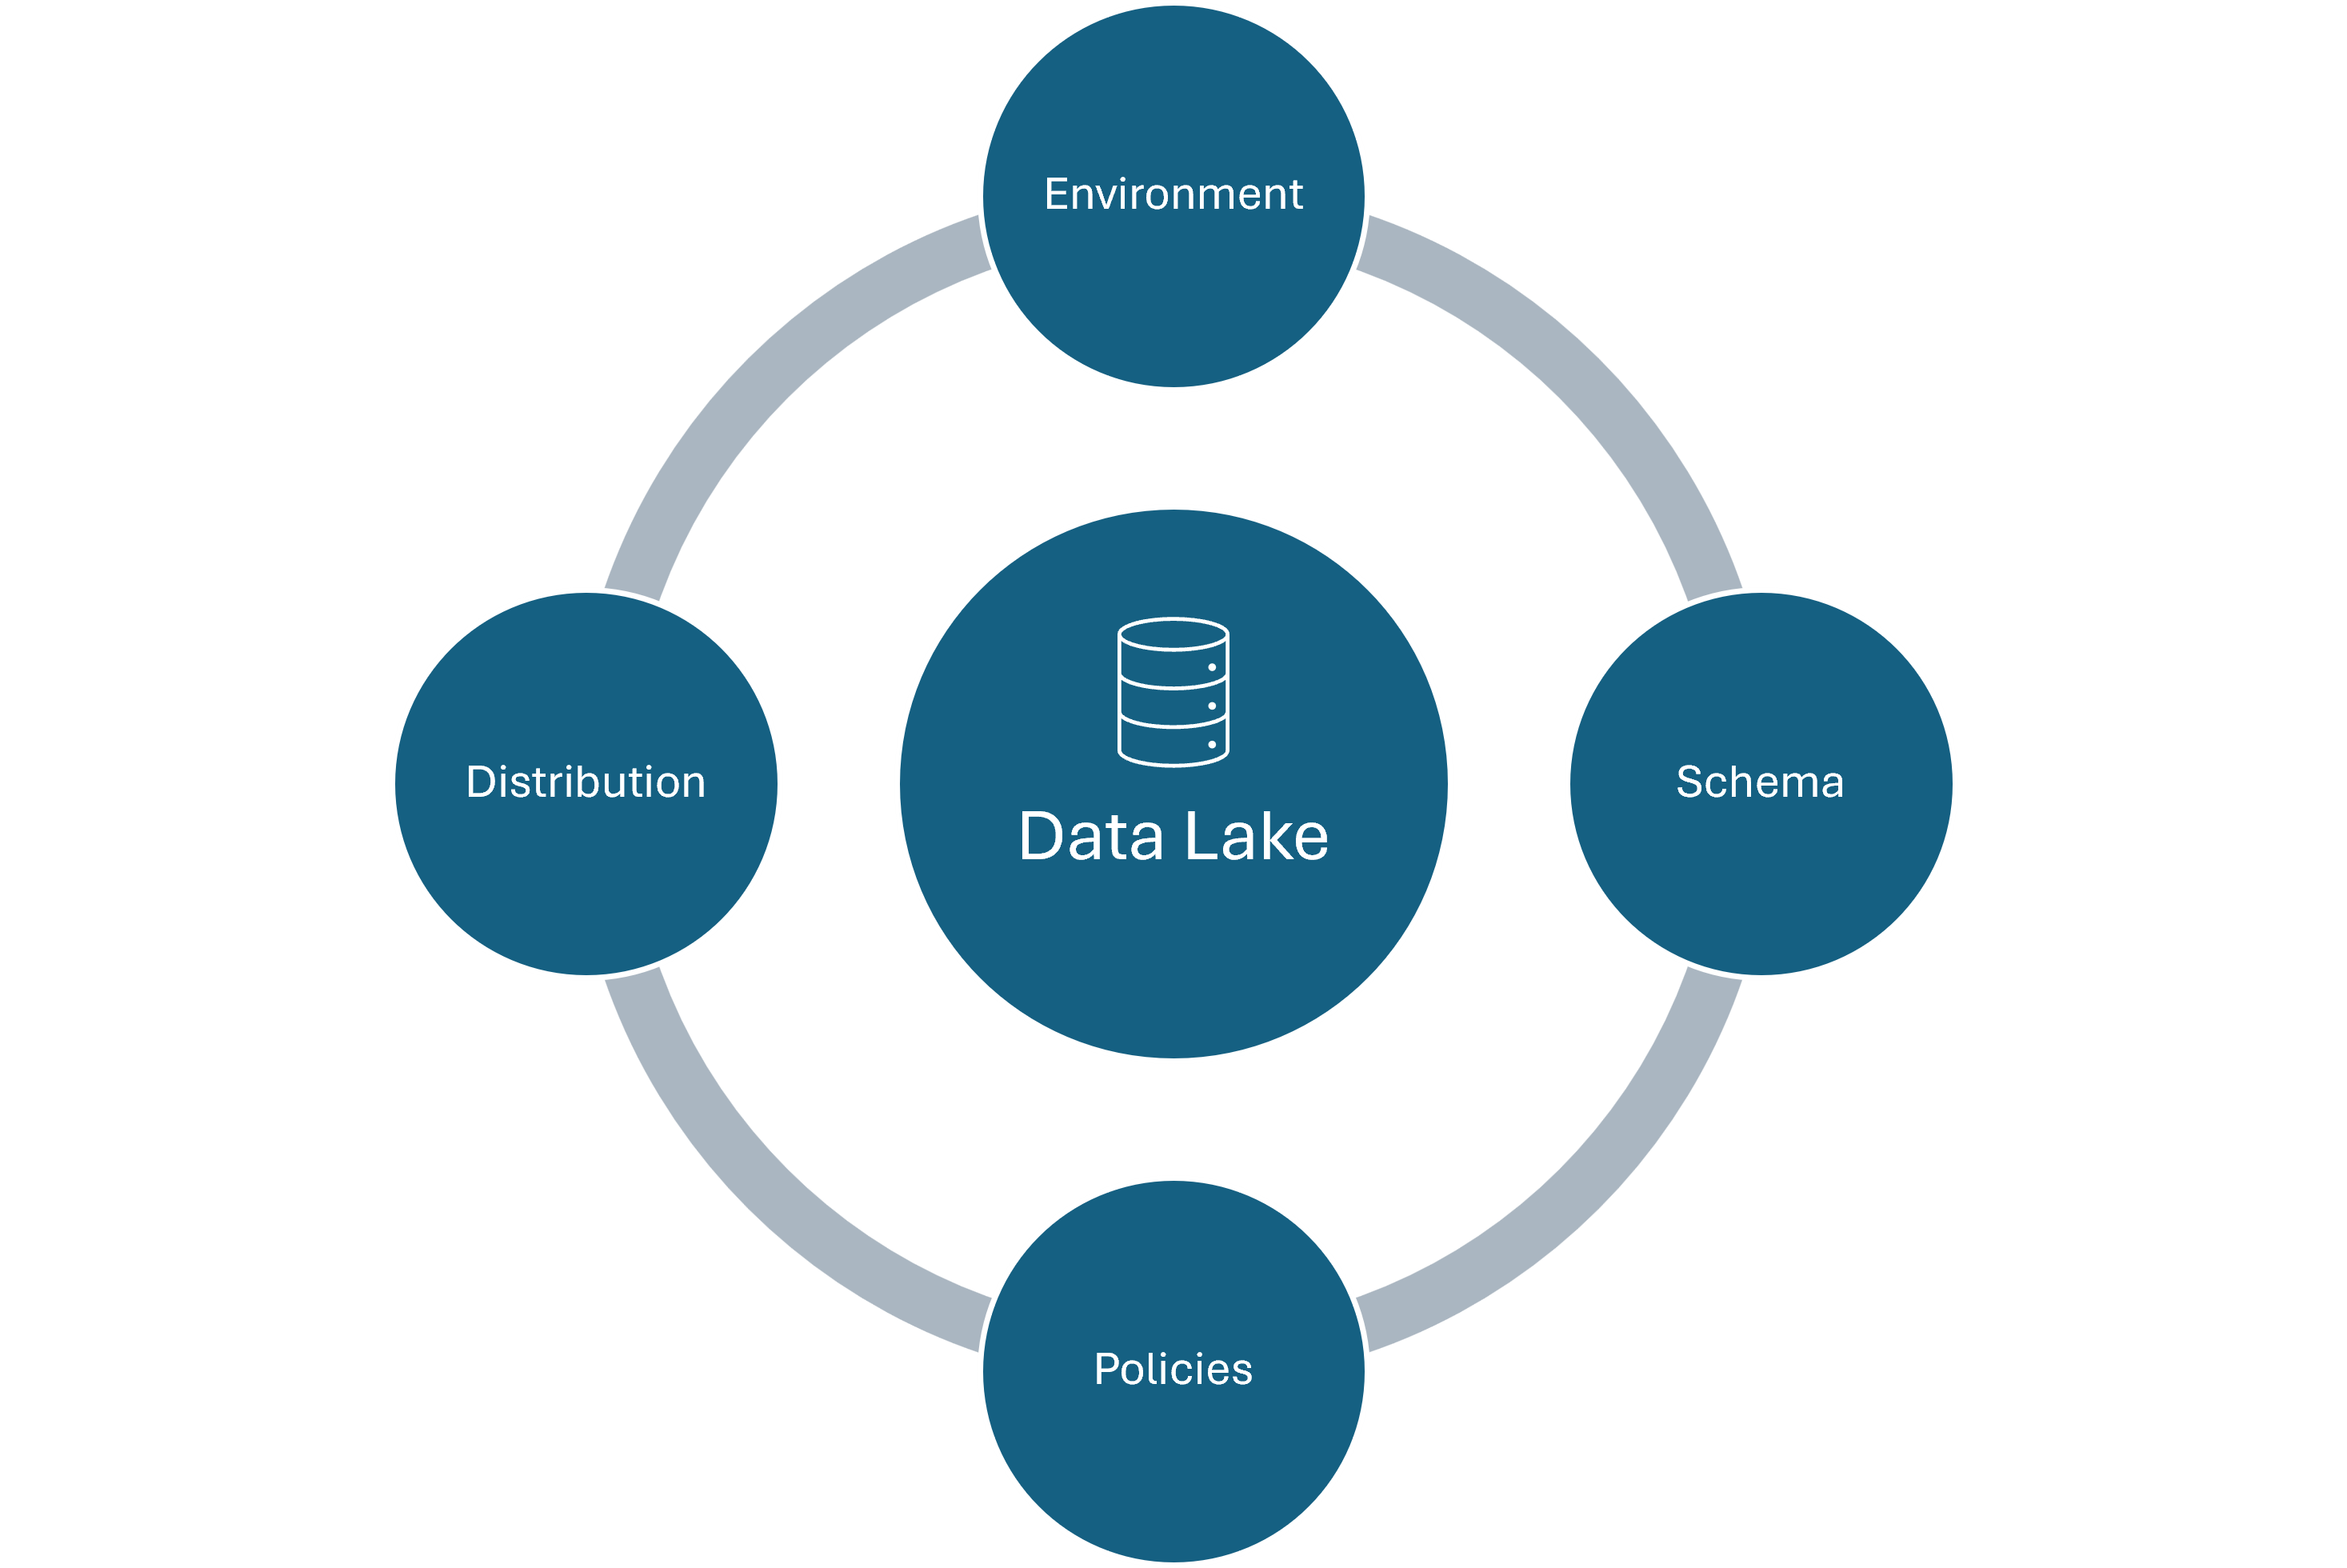
Over the years we have had the opportunity to setup data lakes for our clients. We have worked on key cloud platforms like Azure, AWS and GCP. In this blog I am here to talk about the key considerations that you consider when you think of building a DataLake. I have consolidated my learnings into top 4 Points that talk about 4 key stages of DL development. 1.Environment Setup 2.Schema Setup 3.Policy Definition 4.Data Distribution Environment Setup: When you are in the whiteboard phase of your data lake design, ensure that you have provisioned your infra for development as well as production. A few things that you might want to keep in mind at this stage are: Selection on Cloud Service Provider – Cost, Features and Adaptability concerns – https://venanalytics.io/aws-vs-azure-vs-gcp-perspective-on-features-and-costing/ Data Sources – What is the nature of your data source? Structured/Unstructured/Semi-structured? Sizing – What would be the size of your dev and prod envs? Costing – How much is data ingress, egress, storage and backup costs? Data Duplication – What percentage of prod data will be held in your dev env? Retention Policy – How often do you plan to prune the dev data? Data Validation – What qualifies for a quality data? Define quality KPIs Answering these key questions will direct you in setting up your environments. Schema Setup: Before designing the actual schema, you need to finalize the type of data model you intend to build that will best solve your business case. There are broadly 3 types of Data Models – Dimensional Data Model – Data stored as Facts and Dimension Tables 3NF Data Model – Data stored in highly normalized tables Data Vault – Data stored in Satellite tables and connected by links Here’s a video that will help you understand these data models in detail – https://www.youtube.com/watch?v=l5UcUEt1IzM Once the schema type is finalized, only then start designing each component of the schema. At this point ensure that the right business stakeholders as involved for approvals and suggestions. Define Policies: Database maintenance is as important as the setup itself. The robust policies that we define at the beginning will go a long way in delivering quality data to the right people at the right time. A few policies can be: Access management policy Data purging and backup policy Policy pertaining to Database performance Time out policy Quality Control Defining a few SOP’s at the start can also go a long way. For example, if the end user requests to onboard a new data source – Important things to define would be TAT, Owner, Approval Matrix, etc. Data Distribution: In order to distribute the right data to the right people for the right duration is imperative. Reporting data can be distributed as data models rather than raw data itself. For example, team members can connect to published Power BI models thus saving hours in data modelling. This also ensures that the data quality is centrally governed and so is access control. Here’s a pictorial representation of the difference between the old approach (Direct Access to data base) vs access to Power BI Data Model. A screenshot of a computer Description automatically generated We believe that on an average we save up to 2-3 hours of time per analyst that he would spend in understanding and re-creating the data model. The 4 key points mentioned above provide you with a basic framework to initiate your DataLake Project. The above framework is ideal for reporting needs of a midsize organization.

Posted on Dec 13, 2024 by Shubham Chaudhari on Data Model Distribution via Power BI Data analysis and reporting are at the heart of every successful data-drive organization. Power BI, a user-friendly and robust business intelligence tool, allows companies to transform raw data into meaningful insights and share them effortlessly. But effective distribution of these data models isn't just about sharing reports—it requires strategic planning to ensure that insights are accessible, secure, and run smoothly. In this guide, we'll break down simple and effective strategies for distributing Power BI data models so you can get the most value from your data. 1. What Is Data Model Distribution in Power BI? Sharing of content across the organization (or outside) in a secure way is possible using Power BI Service. We can either share Power BI reports or empower our teams to build custom reports by publishing centrally governed datasets. These datasets in Power BI are called Data Models. Depending on your role in the organization, the definition of content will differ for you. If you are an Analyst or an author in liaison with the business user, you would be developing reports and sharing these with the end users. However, if you are part of the data engineering or a central IT team, your definition of content is the data models that empower Authors to develop reports. 2. Picking the Best Way to Share your Data Model Power BI provides multiple avenues for distributing your data models, each designed to cater to specific needs. Let’s break down these methods so you can decide which one works best for your situation. A. Workspaces: A Collaborative Space for Teams: Workspaces in Power BI serve as a shared environment where team members can manage and collaborate on reports, dashboards, and datasets. They are designed to facilitate teamwork while ensuring data security through role-based access controls. Role Assignments: Within a workspace, you can assign different roles that determine what actions a user can perform: Admin: Completely controls the workspace, including managing content, members, and settings. Member: Can create and edit reports but doesn’t have control over administrative settings. Contributor: Allowed to build and update content but restricted from sharing it or changing permissions. Viewer: Can only view reports and dashboards, with no ability to make edits. Benefits of Collaboration: Workspaces make it easy to co-author reports, track changes, and update datasets collaboratively. For instance, your business team can work together to update the campaign performance dashboards and ensure everyone has access to the latest insights. Controlled Access: You can restrict sensitive reports to certain roles. For example, budget reports can be limited to finance teams, protecting confidential information while still encouraging collaboration where necessary. B. Sharing Links: A Quick Way to Distribute Insights: When speed and simplicity are priorities, Power BI’s link-sharing feature is an effective way to get reports into the hands of your audience. This method is straightforward and doesn’t require users to navigate complex data models. How It Works: You can generate a unique link for any report or dashboard in Power BI, which can then be shared with the audience. Setting Permissions: You can decide whether the link allows users to view or, in some cases, edit the content. Most organizations restrict these links to viewing only, ensuring that the data model remains secure and unaltered. Use Scenarios: Link sharing is great for when you need to distribute reports quickly, such as sharing a sales update with managers or providing an overview of key metrics to executives. The simplicity of this method ensures everyone can easily access and understand the insights without any technical hurdles. Security Aspects: Always be cautious with permission settings. Make sure the link is accessible only to people who need it, especially if the report contains sensitive information C. Embedding: Embedding is a more sophisticated option that allows Power BI reports to be incorporated directly into other applications, providing users with a streamlined experience. It’s particularly beneficial for companies looking to integrate analytics into their daily workflow. Embedding Types: Internal Integration: This allows employees to access Power BI reports from within commonly used business apps, like a CRM or internal portal. This saves time and keeps data right where it’s needed the most. Public Display: In cases where reports need to be shared with an external audience, like on a website or in a client-facing app, embedding is a seamless way to present insights. However, make sure that no confidential information is included in publicly accessible reports. Data Security: Embedding comes with robust security features. Unlike sharing the data model directly, embedding keeps your dataset safe, as external viewers cannot access the underlying data. Power BI enforces security through mechanisms like token-based authentication and permissions tied to Azure Active Directory. 3. Keeping Data Safe and Secure Data security is non-negotiable when sharing insights. Here are some ways to protect your data models: Role-Based Access Control (RBAC): Assign roles like viewer or editor to manage who can see or edit your data. For instance, you can ensure that only finance staff access financial reports. Row-Level Security (RLS): Limit what data each person can see based on their role. For example, someone from the East Coast office should only view data relevant to their region. Data-Level Security: Further tighten security by restricting data access based on user groups or specific attributes. Data Encryption: Always encrypt your data both when it’s stored and when it’s being transferred to keep sensitive information safe. 4. Making Your Data Models Run Faster Large datasets can slow down your reports. To keep things efficient, follow these tips: Reduce Data Load: Only load what you need. Use filters or query-specific fields to lighten the data load. These speeds up performance and saves memory. Use Aggregations: Summarize large datasets into aggregated tables. These tables provide quick answers to common queries without needing to process every data point. Streamline DAX Calculations: Simplify your DAX formulas. Complex calculations can slow down your reports, so use efficient DAX expressions whenever possible. Minimize Relationships: Keep your data model simple. A star schema design (with central fact tables connected to dimension tables) makes data retrieval faster and more reliable. Creating parameters tailored to your data and integrating them into your SQL queries via Power Query is an efficient strategy for importing only the data you truly need. By defining parameters, for e.g., Account_ID, Advertiser_ID, Start Date and End Date, you can dynamically filter and control which records are pulled from your data source. This method is particularly beneficial for restricting data to a specific date range, ensuring your model stays streamlined and efficient. For instance, imagine needing data only for the month of October. You could create Start Date and End Date parameters and configure your SQL query to import data within these dates. As a result, only the necessary records are loaded into your model, minimizing memory usage, and speeding up processing. Note: The parameters mentioned, such as Account_ID and Advertiser_ID, are specific examples that align with the structure of a particular report. In your scenario, you can define similar parameters that suit your data model's requirements. 5. Keeping an Eye on Distributed Data Models Even after distribution, your job isn't over. Here’s how to keep everything running smoothly: Track Usage: Power BI’s usage metrics let you see who’s using the reports and how often. This helps you identify underused reports or areas for improvement. Manage Data Refreshes: Set data refresh schedules that match your organization’s needs. Refreshing too often can strain your resources, while not refreshing enough can make your data stale. Regular Updates: Listen to user feedback and continuously optimize your data model. Test any updates thoroughly to make sure they don’t break existing reports or slow down performance. 6. Collaborate and Govern Wisely Good collaboration and governance keep your Power BI data models reliable: Document Everything: Clearly explain your data sources, relationships, and any special calculations. Documentation makes it easier for others (and your future self) to understand the model. Version Control: Keep track of changes to your data models. Version control helps you roll back to previous versions if needed. Data Governance Framework: Set up rules for how data is managed, named, and used. This ensures consistency and makes it easier for people to understand and trust the data. 7. Wrapping it Up Sharing Power BI data models can significantly boost your organization’s ability to make data-driven decisions. By choosing the right sharing method, securing your data, and optimizing performance, you’ll ensure your reports are effective and easy to use. Whether you’re a Power BI veteran or just starting, these strategies will help you get the most out of your data models. Remember, it’s not just about creating insights—it’s about sharing them efficiently, so they drive action and results. Please drop us a mail on hello@venanalytics to get a free consultation for your Data Model Distribution via Power BI.