Business Case:
Understand advertisement spends through the three mediums of TV, Radio and Print along with key metrics like GRPs, NGRPs, SOVs across multiple media channels and Dayparts.
Solution:
Analyzing the spending across mediums and diving deeper into the sectors and the product itself. We also want to understand how the key metrics impact these products on a more granular level across a specific time.
Technology used:
Power BI and Excel
Data Source:
- TAM for Spends Data
- BARC for Viewership Data
The report is divided into 8 sections and here’s an overview of some of the sections:
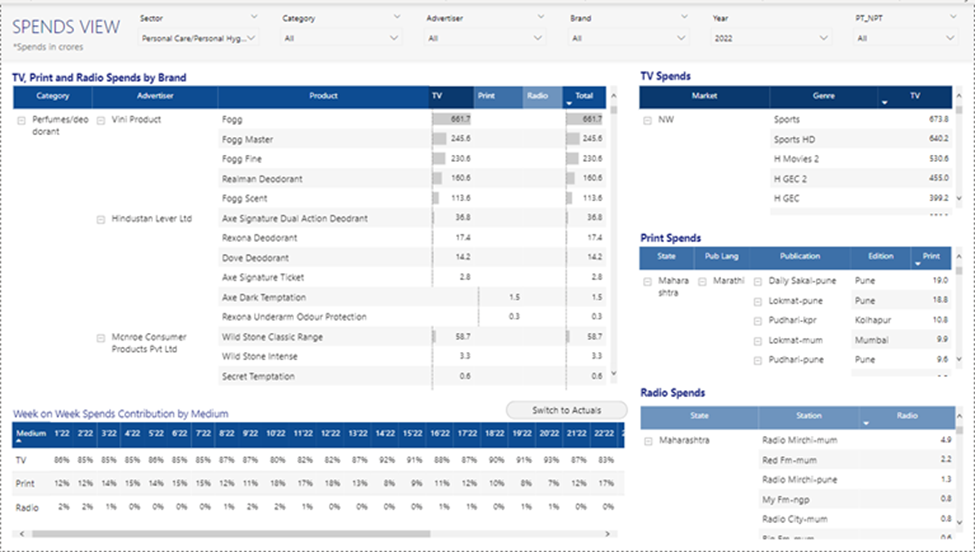
Spends View
Gives us an overview of spends and dives further into the advertiser and brand of the product. We can also understand week on week spends and delve deeper into individual mediums and their genres (TV), publication and language (Print) and station (Radio).

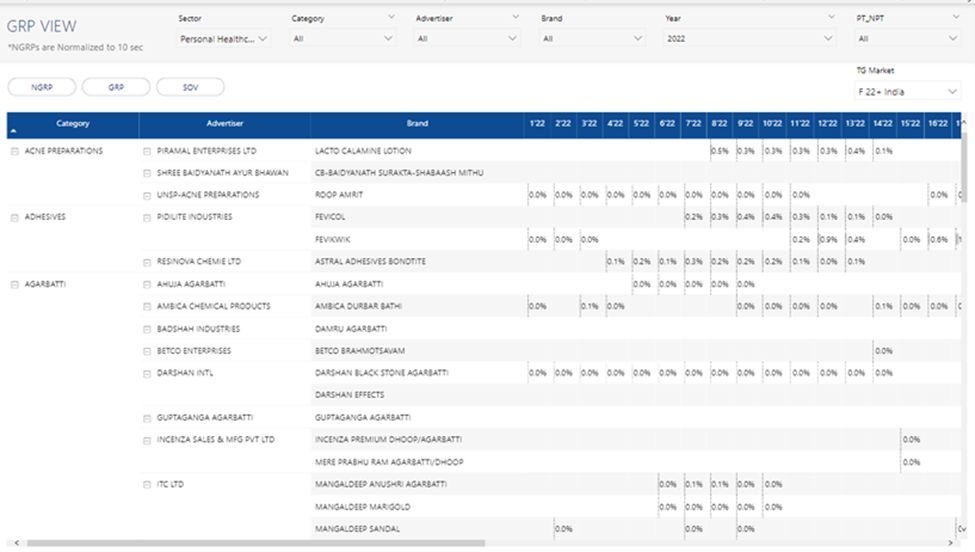
GRP View:
Gives us an overview of GRPs, NGRPs (normalised to 10 sec) and SOV of a products in terms of week and the TG Market.

Top N Analysis:
Gives us a more detailed and layered analysis on the top ten advertisers, brands and categories in terms of spends and the key metrics.


