

This article is for all Media Planners, Analysts, and Data Engineers dealing with digital campaign management platforms like Google Ads, DV360 or Meta. We have extensively worked on the reporting side of these platforms, and or experience says that creating a scalable data model for your reporting teams can turn out to be quite challenging. Also, if you can achieve this, a large chunk of your organization’s reporting needs can be catered to, thus enabling them to create scalable Reporting solutions as we have done with our clients.
To understand the data model for the 3 platforms mentioned above we will consider the 3 points:
- Data Granularity
- Relationship between Fact and Dimension Tables
- Metrics/Dimensions Compatibility
In my experience, working with multiple planning and analyst teams there are a few reports that will be constantly consumed, and I will show you how to bring it all together. We will create a robust model that will ensure usability and scalability. In the subsequent sections I have highlighted the key reports and their relationship with one another. With the help of this article, you will be able to create such data models in SQL or Power BI in no time.
Google Ads:
- Granularity – Date, ad, device_type, Region/AgeGender
- Relationship between Fact and Dimension Tables
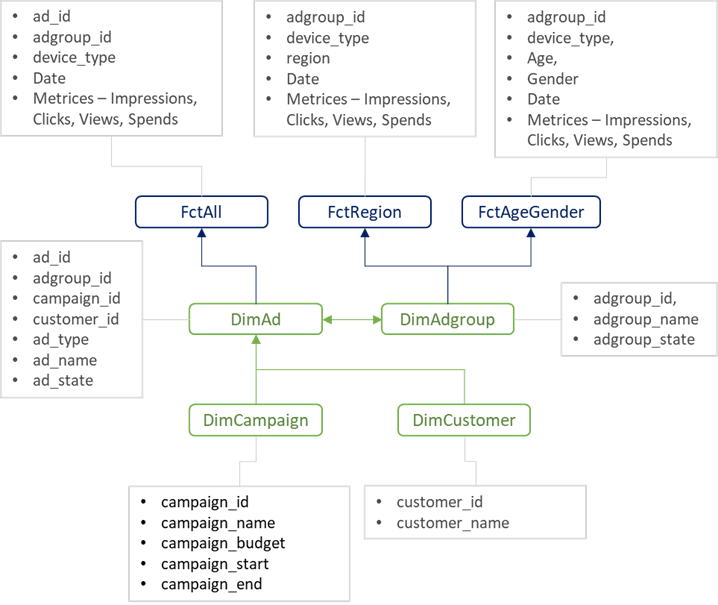
3. Metrics/Dimensions Compatibility:
Each table that we see above can be fetched as a report from Google Ads API. However, the not all dimensions and metrices are compatible with each other. For Example, Age and Geographic details can not be fetched in the same report. Therefore, one needs to have a clear understanding of the reporting needs vs the API limitations.
Documentation link: https://developers.google.com/google-ads/api/fields/v16/overview.
DV360:
- Granularity – Date, lineitem, creative, device_type, Region/AgeGender
- Relationship between Fact and Dimension Tables
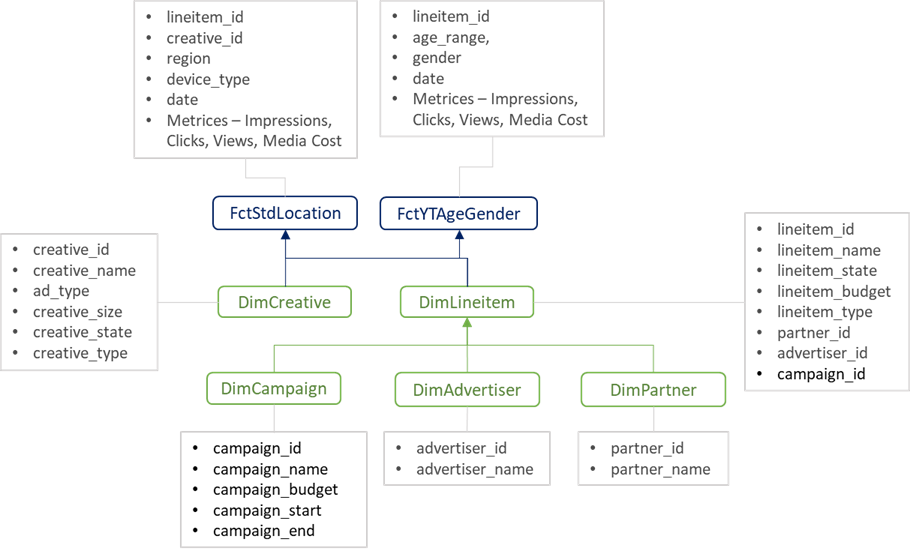
3. Metrics/Dimensions Compatibility:
One major compatibility consideration in case of DV360 is that of Youtube Campaigns. Standard reports will encompass Youtube Campaigns, however, to get an Age/Gender split of the data we use Youtube Reports.
Documentation link: https://developers.google.com/display-video/api/reference/rest/v3.
Meta:
- Granularity – Date, ad, adset, Device/Region/Age&Gender
- Relationship between Fact and Dimension Tables
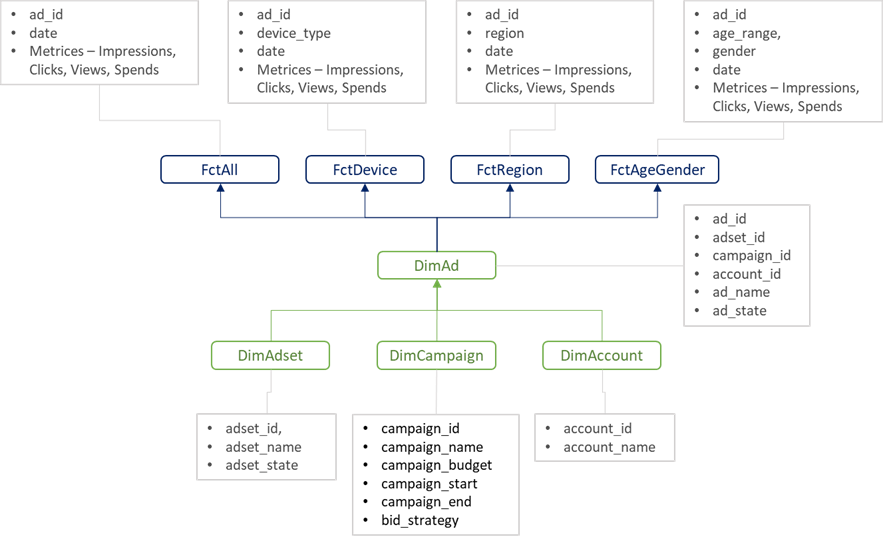
3. Metrics/Dimensions Compatibility:
In case of Meta, we have 4 reports – All, Device, Region, and Age/Gender. The reason we have used FctAll report is because it enables us to fetch certain metrices that are otherwise not possible with other reports.
Documentation link: https://developers.facebook.com/docs/marketing-apis/overview.